Introduction to Browser DevTools
Modern online browsers have a built-in suite of web development and debugging tools called Browser DevTools, or Browser Developer Tools. With the aid of these tools, developers may examine, troubleshoot, and improve websites and applications. Every major browser, including Microsoft Edge, Opera, Firefox, Safari, Chrome, and Firefox, has a built-in suite of DevTools.
Overview of Frontend Debugging with Browser DevTools
Opening DevTools
- Right-click on any webpage element and choose “Inspect” or use keyboard keys (F12 or Ctrl+Shift+I in most browsers) to launch DevTools.
- Another way to get DevTools is to click the three dots in the browser’s menu (usually labeled “More tools”) and choose “Developer tools.”
Elements Panel
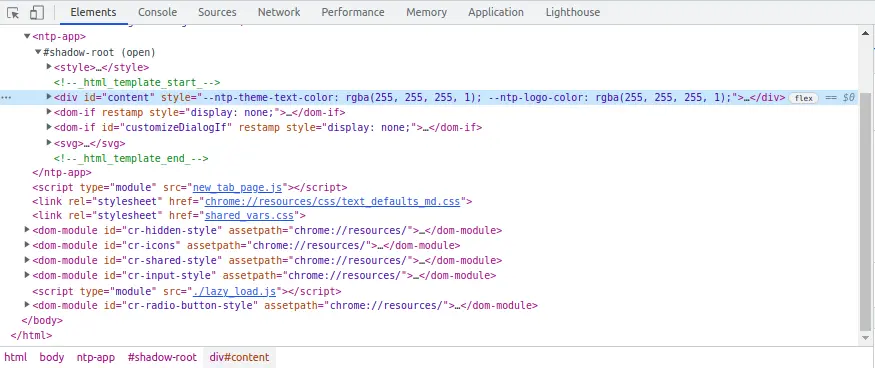
- You may examine a web page’s HTML and CSS with the Elements panel.
- Choosing elements in the DOM allows you to view and adjust their properties, styles, and attributes in real-time.
- This panel also shows a live preview of modifications, making it easy to experiment with different design options.
Console Panel
- To test assumptions or analyze variables, run JavaScript code snippets directly in the console.
- You can Write some JavaScript into the Console and press “Enter.” The Console will evaluate the code and print the result.
- You can also use the “Console” to debug your code. To do this, set a breakpoint in your code with the “debugger” keyword. When the code execution hits the breakpoint, the Console will pause and let you step through the code.

Debugger Panel (Sources)
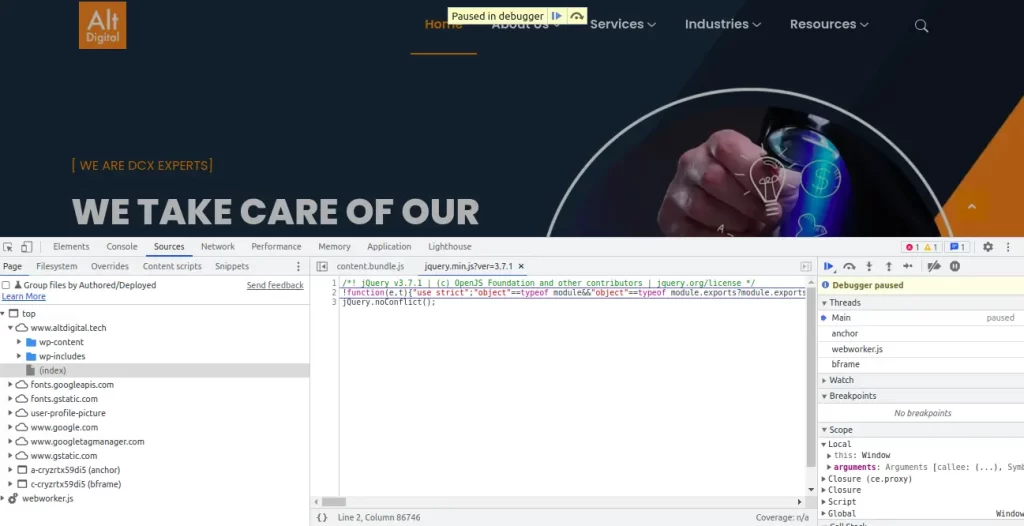
- You can set breakpoints in your JavaScript code using the Debugger panel.
- Step-through code execution, examining variables, and observing expressions are all possible.
- It’s very helpful for figuring out code flow and locating runtime issues.
Network Panel
- Your webpages’ network queries are tracked by the network panel.
- The Network panel keeps track of all network requests and displays information, such as headers, payloads, and response data.
- Debug AJAX queries, resource loading, and API calls with this panel.
- You can see the status, request/response headers, and content of each request.

Performance Panel
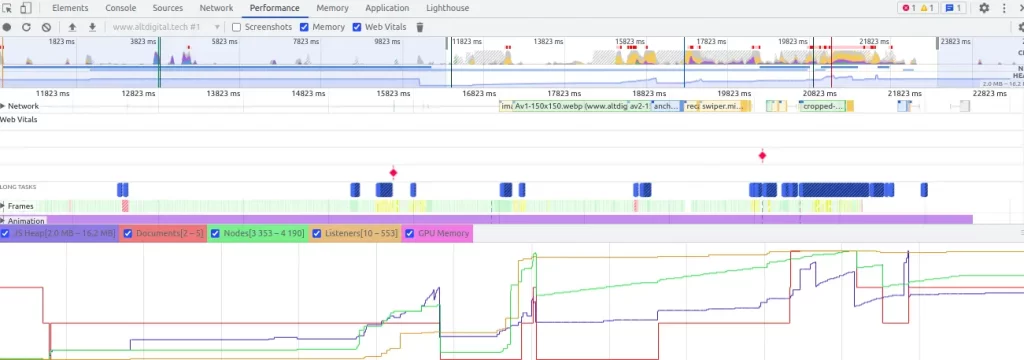
- You may examine the runtime performance of your webpage using the Performance panel.
- Keep track of performance information, such as CPU and memory consumption, and locate any bottlenecks.
- Make use of it to improve user experiences with your code.
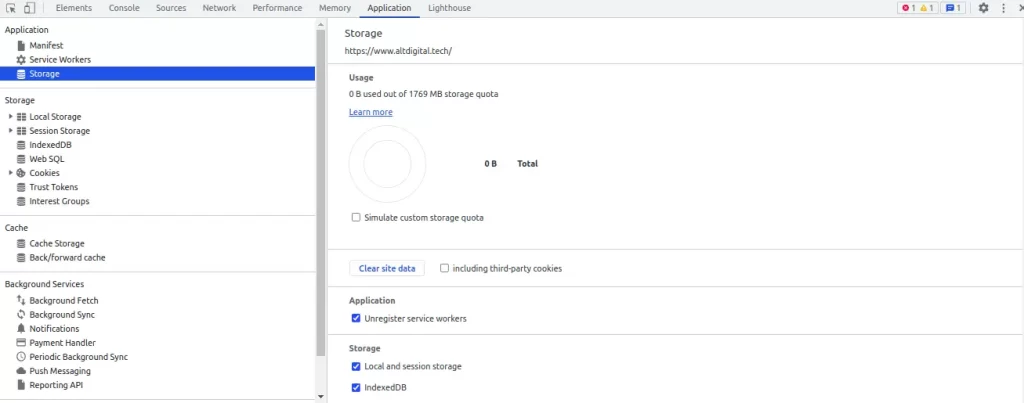
Application Panel (Storage)
- You may see and edit client-side storage, including cookies, local storage, and indexed databases, using the Application panel.
- You may view, modify, and remove saved data.
- Useful for debugging issues related to data storage and caching.
Security Panel
- The Security panel displays information about a web page’s security status, including HTTPS details and insecure content alerts.
- The Security panel may also be used to modify the security configuration of your website. Click the “Security” button at the top of the panel to modify the security settings for your webpage. This opens a dialogue box where you may adjust the security settings for your webpage.

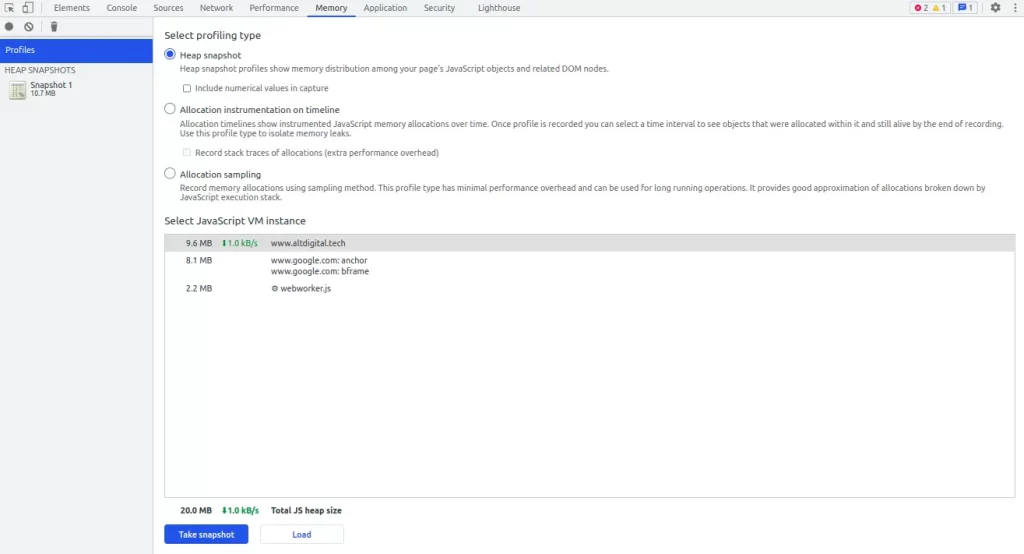
Memory Panel
- You can view the amount of memory that your page is consuming in the Memory panel. Using the Memory panel, you can check which resources are using up memory and where memory leaks are happening.
- You can identify the specific type of resource, its memory use percentage, and the time since it was last accessed.
Lighthouse Extension
Lighthouse is an open-source, automated tool for improving the quality of web pages. It can be run in Chrome DevTools, from the command line, or as a Node module. When you give Lighthouse a URL to audit, it runs a series of audits against the page and then generates a report on how well the page did. The failing audits can be used as indicators of how to improve the page.
Lighthouse is integrated directly into the Chrome DevTools, under the “Lighthouse” panel. To run a report, you can follow these steps:
- Open Chrome DevTools.
- Go to the URL you want to audit.
- Click the Lighthouse tab.
- Click Run audit.
Conclusion
Browser DevTools are essential for front-end developers because they allow them to troubleshoot bugs, optimize performance, and assure the quality of their online apps. Familiarising yourself with these tools and their capabilities can significantly improve your web development abilities.


