What is AppDynamics?
AppDynamics is a top-tier Application Performance Management (APM) product. It’s a cloud-based platform that offers comprehensive observability and performance insights for applications and users.
The way AppDynamics works is by starting with Agents and the Controller. These agents are essentially plug-ins or extensions that are spread across your entire application ecosystem. They monitor the performance of your application code, runtime, and behavior.
One of the standout features of AppDynamics is its ability to auto-discover and map your application. This helps you understand the structure and behavior of your application.
Another key feature is Digital Experience Monitoring. This allows you to visualize the digital experience between your users and your business, ensuring a seamless, hassle-free experience at every touch point.
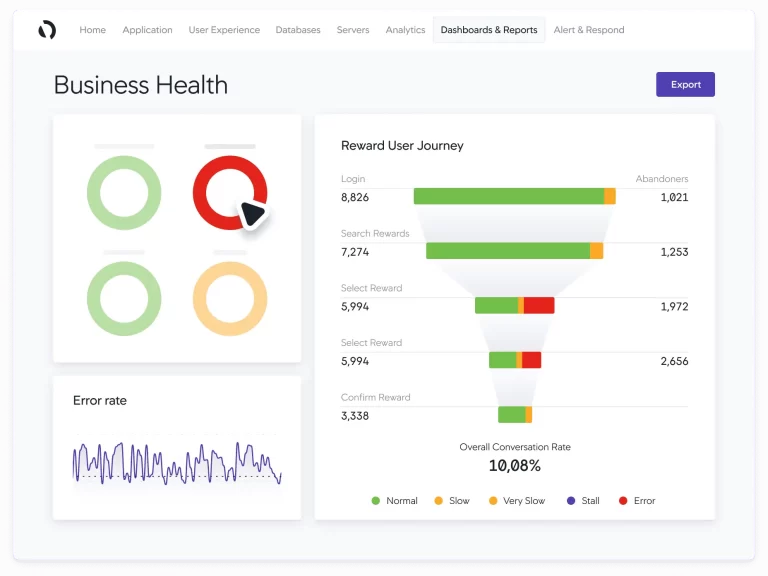
AppDynamics also offers Business Transaction Monitoring. This feature allows you to correlate full-stack performance with key business metrics like conversions. This means you can quickly resolve issues before they impact the bottom line.
Anomaly Detection and Root Cause Diagnostics is another feature that helps in identifying and diagnosing the root cause of performance anomalies.
Finally, Full-Stack Analytics provides insights into your application’s performance from the front-end user interface to the back-end database and everything in between.
AppDynamics supports all major technologies such as Java, .NET, PHP, Node.js, NOSQL, etc. It can be installed either as an on-premise solution or as a SaaS (Software as a Service) solution. This makes it a versatile tool that helps enterprises monitor, analyze, and optimize their environment to any extent needed.
What is an Observability Platform?
An observability platform is essentially a tool that helps in gaining insights into software applications and their environments. It’s like a window into the world of your software, allowing you to see what’s happening inside your applications and infrastructure. This deep visibility is crucial for identifying and resolving problems quickly and efficiently.
The term “observability” refers to how well you can understand the internal state of a system based on what it outputs externally. Observability platforms take in operational data, or telemetry, from various sources such as logs, metrics, events, and traces. This data is then used to monitor, troubleshoot, and debug applications and networks, ensuring they meet customer expectations, service level agreements, and other business requirements.
Observability is often seen as an evolution of traditional monitoring methods like Application Performance Monitoring (APM) and Network Performance Management (NPM). It doesn’t replace these methods, but rather enhances them, making them more suited to the dynamic and distributed nature of modern cloud-native applications.
There are several observability platforms available today, including Cisco’s AppDynamics, IBM’s observability solution, and Grafana, an open-source analytics and monitoring solution. These platforms provide the tools necessary for maintaining high-quality software and ensuring a smooth user experience.
What is an Application Platform Monitoring (APM)?
Application Performance Monitoring, or APM, is essentially a way to keep an eye on how an application is performing. It’s all about measuring, analyzing, and optimizing the performance of an application. This is done by tracking various metrics and indicators that can help identify any performance issues or bottlenecks.
An APM platform is a tool that brings all of this together. It uses artificial intelligence and automation to provide a precise, context-aware analysis of the application environment. This allows organizations to continuously monitor the full stack for any system degradation and performance anomalies.
There are several key benefits to using APM. One of the main ones is that it can help improve the user experience. By measuring the quality of the applications that make up your product, APM tools can provide key insights into the user experience and valuable data to identify areas for improvement.
Another major benefit is the ability to rapidly diagnose application performance issues. APM can point IT teams directly to the problem, keeping downtime to a minimum. This can also lead to reduced operating costs, as IT teams can use APM tools to determine how much resource, infrastructure, and computing power is necessary to keep applications performing optimally.
APM tools can also be part of a product’s development process. Development teams can tap into actionable insights before an application goes live and fix bugs that would previously only have become evident after launch.
Finally, APM platforms represent collected data in dashboards and charts. This transforms raw data into useful metrics that are easier to read and understand. This simplifies the data analysis process and directs your attention toward specific problems you should address. So, in essence, APM is a powerful tool for any organization that relies on applications for its operations. It provides a comprehensive view of application performance, helping to ensure optimal performance and a great user experience.
Key Features
AppDynamics is a comprehensive application performance management (APM) and IT operations analytics (ITOA) platform. Here are some of its key features:
Application Performance Monitoring (APM): This feature allows you to monitor the performance of your application in real-time. It provides insights into how your code is running and helps identify any bottlenecks or issues that may be affecting performance.
Infrastructure Visibility with Database Visibility: This feature provides detailed insights into your database operations. It can help you understand how queries are being executed and how they are affecting the overall performance of your application.
End User Monitoring for Client Experience: This feature focuses on the experience of the end user. It tracks the performance of the application from the user’s perspective, from the initial request to the final response.
Auto-Discovery and Mapping: This feature automatically identifies and maps out your application architecture. This can be incredibly useful for understanding how different components of your application interact with each other.
Business Transaction Monitoring: This feature allows you to track key business transactions. These are the series of steps that a user takes to complete a specific task within your application.
Anomaly Detection and Root Cause Diagnostics: This feature helps identify any unusual behavior in your application and diagnose the root cause. This can be particularly useful for identifying and fixing issues before they affect your users.
Full-Stack Analytics and Custom Dashboarding: This feature provides a comprehensive view of your application’s performance across the full stack. It also allows you to create custom dashboards to display the information that is most relevant to you.
Code-Level Visibility: This feature provides insights into the performance of your application at the code level. This can help you identify any specific areas of your code that may be causing performance issues.
Trend Database Performance: This feature allows you to track the performance of your database over time. This can help you identify any trends or patterns that may be affecting performance.
Continuous Monitoring: This feature ensures that your application is constantly being monitored, even in high-volume environments. This can help you quickly identify and address any issues that may arise.
These features work together to provide a comprehensive view of your application’s performance, helping you to ensure that your application is running smoothly and efficiently.
How does AppDynamics Work?
AppDynamics is a leading Application Performance Management (APM) product. It works by collecting data through Agents and the Controller. Agents are plug-ins or extensions that monitor the performance of your application code, runtime, and behavior across your entire application ecosystem. The Controllers receive real-time performance data from the agents, visualize your application performance, and send instructions to the agents.
One of the key features of AppDynamics is its ability to auto-discover and map various subsystems and backends. It learns application behavior and automatically sets baselines, alerting when there is a deviation from the norm. This is particularly useful for monitoring what AppDynamics calls ‘Business Transactions’. A Business Transaction represents a service provided by your application that is invoked by the user. AppDynamics tracks and reports all subsystems and backends involved in a Business Transaction.
AppDynamics also provides full-stack analytics by offering code-level visibility. After installing agents and controllers on the applications to monitor, each line of code is monitored by the AppDynamics agent, which collects performance metrics. These metrics are forwarded to the AppDynamics controller, which processes them and sends visual reports to the web browser.
Finally, AppDynamics allows for custom dashboarding, putting your IT teams at the center of business success. Real-time information gives the ability to focus on today’s problems. AppDynamics supports all major technologies and can be installed as an on-premise or a SaaS (Software As a Service) solution. It drives business outcomes by putting application health in the context of your business while providing unparalleled observability across tools, services, and infrastructure on the backend.
Why Should You Use AppDynamics?
AppDynamics is a comprehensive tool that provides business observability by giving you a complete view of your entire stack’s performance. It starts data collection with Agents and the Controller, which monitor your application code, runtime, and behavior.
One of the key features of AppDynamics is its ability to auto-discover and map applications in the cloud environment and on servers. This helps in managing and understanding the workings of your applications.
In addition, it offers digital experience monitoring, providing unparalleled observability across tools, services, and infrastructure on the backend. This is complemented by business transaction monitoring, which allows businesses to identify potential issues, ensure optimal use, and provide a seamless user experience online.
AppDynamics also excels in anomaly detection and root cause diagnostics. It records the entire working of the application, even if the app does not show any mode of failure. This helps in identifying and resolving issues before they impact the end users.
Lastly, it offers full-stack analytics and custom dashboarding, providing visibility to all the applications inside the system and their workings.
AppDynamics Products
AppDynamics offers a range of products that focus on application performance management (APM) and business observability. Here are some key products and their features:
Observability Platform: This is the foundation of AppDynamics’ services. It provides insights that are crucial for digital transformation. It allows teams to identify application issues in real-time, from 3rd party APIs to code-level issues. It also helps optimize infrastructure by visualizing every component – from server to database, to hybrid and cloud-native environments.
Cisco Cloud Observability Platform: This product, powered by the Cisco Full-Stack Observability (FSO) Platform, provides observability across technology landscapes from the application layer down to Kubernetes® and cloud infrastructure.
Full-Stack Correlation: This feature allows you to correlate full-stack performance with key business metrics like conversions and quickly resolve issues before they impact the bottom line. This means it can link the performance of the entire tech stack (from front-end to back-end) with important business indicators, helping to quickly identify and resolve problems that could affect profitability.
User Experience Monitoring: This feature helps visualize the digital experience between your users and your business and ensures a seamless, hassle-free experience at every touch point. In other words, it helps you understand how users interact with your business digitally and ensures they have a smooth experience at all stages.
Automated Actions: This feature helps continually optimize your application environment with a vast ecosystem of interconnected technology partnerships. This means it can automatically make adjustments to your application environment based on insights from a wide range of technology partners.
SAP Performance Monitoring: AppDynamics offers comprehensive SAP observability, which is essential for monitoring and managing SAP. This means it provides a complete view of the performance of SAP applications, which is crucial for managing and optimizing these applications.
AppDynamics can be deployed on-premise or as a SaaS. This means you can either install it on your own servers (on-premise) or access it over the Software as a service (SaaS). They also offer a marketplace with partner solutions that extend their platform. This is a place where you can find additional solutions from partners that can enhance the functionality of the AppDynamics platform.
AppDynamics Pricing
AppDynamics offers several pricing plans:
Infrastructure Monitoring Edition: This plan costs $6 per month for each CPU Core. It’s designed for monitoring your IT infrastructure.
Premium Edition: Priced at $33 per month per CPU Core, this plan offers more advanced features.
Enterprise Edition: This is a comprehensive plan costing $50 per month per CPU Core. It’s designed for large enterprises with complex needs.
Enterprise Edition for SAP® Solutions: This specialized plan costs $95 per month per CPU Core and is tailored for businesses using SAP solutions.
Real User Monitoring: This plan costs $.06 per month for every 1000 tokens. It’s designed to monitor the experience of your actual users.
Cisco Secure Application: This security-focused plan costs $13.75 per month per CPU Core.
These prices are for purchases made in the United States. For pricing in other regions, you would need to contact a sales representative. Also, these prices are subject to change, so it’s always best to check the official website or contact AppDynamics for the most accurate and up-to-date information.
Supported Technologies of AppDynamics
AppDynamics supports a wide range of technologies. Here are some of them:
.NET: AppDynamics provides .NET application monitoring, which supports all common .NET monitoring frameworks. It offers simplicity, visibility, and scalability while maximizing performance.
Java: AppDynamics supports a variety of Java environments and versions. It uses the standard JVM Tool Interface (JVMTI) mechanism, allowing it to instrument any software running on a JVM supporting this mechanism.
Databases: AppDynamics supports monitoring for various database systems. It is compatible with both 32-bit and 64-bit servers.
iOS: AppDynamics provides real-time insights into your iOS mobile application performance around the world.
PHP: AppDynamics supports PHP application performance monitoring. It provides auto-discovered business transactions, dynamic baselining, code-level diagnostics, and Virtual War Room collaboration.
Other Technologies: AppDynamics supports over 190 technologies covering Build & Test, Cloud, Database/Data Store, DevOps, Infrastructure, ITSM, Notification & Alerting, Languages & Frameworks, Middleware & Application Servers, Mobile & IoT, and Packaged Applications.
In addition to these, AppDynamics also supports Node.js, NoSQL, and many other technologies. It can be installed as an on-premise or a SaaS (Software as a Service) solution. A piece of software called Agent is installed in the Application to be monitored. The Agent collects the performance metrics and sends them to a Server process called Controller. The user accesses and manages the monitoring data by connecting to the Controller via a web browser.
AppDynamics uses the concept of ‘Business Transaction’ (BT). A BT represents a service provided by your application that is invoked by the user. All involved subsystems and backends for a given BT are tracked and reported by AppDynamics.
Using a special type of agent called Machine Agent’, AppDynamics can monitor hardware too. Basic resource utilization such as CPU, Memory, and Disk usage are monitored.
AppDynamics Solutions Overview
AppDynamics is a leading Application Performance Management (APM) product that provides real-time insights to drive revenue and results. It delivers business context to Cisco full-stack observability. Here are some key features of AppDynamics:
Sure, I’ll break down the key features of AppDynamics mentioned above:
Cloud Migration: This feature assists businesses in moving their applications and services to the cloud. It provides a comprehensive view of all the elements your business relies on, helping you plan and execute the migration smoothly and address any issues promptly.
Cloud Native Monitoring: This feature is designed to monitor applications that are built and deployed in the cloud. It supports popular enterprise cloud services like AWS, Azure, GCP, and OpenShift®, providing real-time insights into application performance.
Serverless Monitoring: Serverless applications can scale automatically and are highly efficient, but they also need monitoring to ensure a seamless user experience. This feature provides visibility into the performance of serverless applications, from the user-end to the back-end.
Microservices Monitoring: Microservices are small, independent services that work together to run an application. This feature helps monitor the health of these microservices and their interactions, improving operational efficiency.
AppDynamics can be installed in two ways: on your own servers (on-premise) or as a cloud-based service (SaaS). It supports a wide range of technologies, making it a versatile tool for monitoring application performance. Essentially, it’s like having a vigilant eye on your computer systems, allowing you to track application performance and quickly identify and resolve any issues.
History of AppDynamics
AppDynamics, a full-stack application performance management (APM) and IT operations analytics (ITOA) company was founded in San Francisco in 2008 by Jyoti Bansal, a former lead software architect at Wily Technologies. Over the next eight years, the company received five rounds of funding totaling $206.5 million. In 2016, AppDynamics was ranked #9 on the Forbes Cloud 100 list.
In January 2017, Cisco announced its intention to acquire AppDynamics for $3.7 billion, just days before a planned IPO of the company. By March 2017, Cisco had completed the acquisition of AppDynamics. The company is currently headed by Linda Tong as an independent business unit within Cisco’s IoT and Applications business.
AppDynamics focuses on managing the performance and availability of applications across cloud computing environments, IT infrastructure, network architecture, digital user experience design, application security threat detection, observability, and data centers. It is used in various sectors such as the financial service sector, healthcare, telecom, manufacturing, and government for full-stack observability and IT infrastructure monitoring.
Customers of AppDynamics
AppDynamics has a diverse range of customers who leverage its services for application performance success in their businesses. Here are a few examples:
Sure, I’d be happy to explain further.
AppDynamics is a company that provides application performance management (APM) and IT operations analytics (ITOA) services. These services help businesses ensure that their applications are running smoothly and efficiently. Here’s a bit more detail on how some of their customers use their services:
Carhartt: This is a US-based apparel company. They use AppDynamics to monitor their IT infrastructure and operations. This helps them ensure that their customers have a smooth and seamless experience when interacting with their digital platforms.
Alaska Airlines: This airline uses AppDynamics to quickly detect issues with its IT systems. With AppDynamics, they’ve managed to reduce the time it takes to detect issues from hours to less than 10 minutes.
AutoNation: This is America’s largest automotive retailer. Their IT teams use AppDynamics to monitor every component of their application delivery chain. This helps them ensure that their applications are performing optimally.
Paychex: This company provides payroll, human resources, and benefits outsourcing services. They use AppDynamics to gain real-time insights into problems, helping them resolve issues quickly.
These companies, along with others like easyJet, Cisco, Kuveyt Türk, Royal Caribbean, Vodafone Italia, MultiChoice, JazzCash, and the Kingdom of Bahrain’s Information & eGovernment Authority, use AppDynamics to gain visibility into their application performance. This helps them deliver better user experiences and drive business results.
In essence, AppDynamics helps these companies ensure that their digital services are running smoothly, which in turn helps them provide a better service to their customers.
AppDynamics Cloud Monitoring
AppDynamics is a comprehensive cloud monitoring solution that provides observability across your technology landscapes. Here are some key features:
Full-Stack Correlation: This feature allows AppDynamics to connect the performance of your entire tech stack with important business metrics. For example, if your website’s load time increases, it could lead to fewer sales. AppDynamics can identify these issues quickly so you can fix them before they affect your revenue.
User Experience Visualization: This feature gives you a visual representation of your users’ interactions with your business. It helps ensure that users have a smooth experience at every point of contact with your business.
Infrastructure Monitoring and Optimization: AppDynamics can monitor your application environment and help you grow and optimize it based on your business priorities. This includes both traditional infrastructures and cloud-native ones.
Data Collection and Correlation: AppDynamics can automatically collect data and correlate cloud-native services to application code. This helps you understand how user experience outcomes impact your business metrics.
Support for Multiple Cloud Platforms: AppDynamics supports various cloud platforms, including AWS CloudWatch, Azure Monitor, Google Cloud Monitoring, and more. This means you can use it to monitor applications across different cloud platforms.
Free Trial: AppDynamics offers a 15-day free trial. This allows you to test its cloud monitoring and Cisco Secure Application features before committing.
AppDynamics Cloud Migration
AppDynamics provides a suite of tools and services to facilitate cloud migration. Here are some key features:
Real-time Performance Monitoring: This feature allows you to track the performance of your applications in real-time. This is crucial during migration as it helps identify and address any performance issues promptly, ensuring a smooth transition.
Pre- and Post-migration Metrics: AppDynamics provides metrics before and after the migration. These metrics help you understand the impact of migration on your business performance and validate the effectiveness of your cloud investments.
Application and Dependency Mapping: This feature gives you a complete view of all your applications and their dependencies. It helps you understand how different applications interact with each other, which is essential for planning and executing a successful migration.
Root Cause Analysis: AppDynamics uses AI to automatically detect anomalies and identify the root cause of any issues. This allows for quick troubleshooting and ensures that your applications continue to perform optimally even after migration.
Dynamic Scaling: This feature allows your applications to scale up or down based on various factors such as user experience KPIs or application latency information. This ensures optimal resource utilization and cost efficiency.
Cloud Potential: AppDynamics supports a wide range of platforms including AWS, Microsoft Azure, Docker, SAP and S/4 HANA, IBM, Kubernetes, OpenShift, and Pivotal Cloud Foundry. This means you can choose the platform that best suits your business needs.
In general, cloud migration is the process of moving your business applications and data from on-premise infrastructure to the cloud. This process offers several benefits such as increased flexibility, scalability, and security. AppDynamics provides the tools and features to help you navigate this process effectively.
Competitors of AppDynamics
AppDynamics, a part of Cisco, is a widely used application performance monitoring (APM) tool. It has several competitors in the market. Here are some of the main ones:
Dynatrace
Dynatrace and AppDynamics are both top-tier providers of Application Performance Monitoring (APM) solutions. When it comes to observability, Dynatrace stands out with its advanced features that provide a complete picture of every app, every user, across every cloud, down to code-level, traces, metrics, logs, and metadata. On the other hand, AppDynamics requires manual configuration and instrumentation for data collection and dynamic workloads.
In terms of AI-assistance, Dynatrace has an edge with its AI-assistant, Davis®, which provides real-time answers and actions into root causes, behavioral intelligence, and business impact. AppDynamics, however, uses a correlation-based data engine, which might require you to sift through the data manually to find issues and their causes.
When we talk about automation, Dynatrace offers zero-config, auto-upgrades, self-discovering, auto-baselining, and continuously updated entity maps with AI-Assistance continuously watching everything 24×7 automatically. In contrast, AppDynamics requires manual agent deployment, manual dependency connections, and manual troubleshooting.
As for user experience and business analytics, Dynatrace provides a single data model across every digital channel that automatically ties together full-stack performance, user experience, and business metrics, creating an outside-in perspective for better business outcomes.
Ease of use is another important factor to consider. Dynatrace is known for its simplicity and ease of use, with automatic deployment, configuration, thresholds, dashboards, and upgrades.
Both Dynatrace and AppDynamics offer cloud monitoring capabilities, provide preconfigured and custom alerts, offer a range of APIs for different purposes, and support a range of third-party integrations.
LogicMonitor
AppDynamics and LogicMonitor are both well-regarded tools for application performance monitoring. AppDynamics has an overall rating of 4.3 out of 5 stars based on 371 reviews. It’s known for its intuitive interface and easy-to-understand charts and graphs. It supports many platforms and allows for customized monitoring. Its ease of use, value for money, customer support, and functionality are rated 4, 4, 4, and 4.5 out of 5 respectively.
On the other hand, LogicMonitor, with an overall rating of 4.5 out of 5 stars from 506 reviews, is found to be easier to use, set up, and administer. It also scores higher in all categories with 4.5 out of 5 for ease of use, value for money, customer support, and functionality.
Reviewers have expressed that LogicMonitor meets the needs of their business better than AppDynamics and they preferred doing business with LogicMonitor overall. They also felt that LogicMonitor provides better ongoing product support and they preferred the direction of LogicMonitor over AppDynamics for feature updates and roadmaps.
Datadog
Datadog and AppDynamics are both popular application performance management (APM) tools, but they have different strengths. Datadog is a cloud-focused monitoring and security platform that provides visibility into any stack or application at any scale. It’s particularly effective at managing the performance and visibility of multiple clouds operating on the network. On the other hand, AppDynamics aims to simplify the management of complex applications by providing full-stack observability with business context. It allows users to monitor the performance of the entire IT stack and view the performance through the lens of the business.
When it comes to implementation and ease of use, Datadog’s installation is straightforward via the deployment of agents, but it does require some command-line scripting. However, it’s relatively easy to customize dashboards and interfaces. AppDynamics is reported as being easy to install via agents and its interface is considered easy and intuitive.
In terms of security, AppDynamics is considered superior. For data analytics, Datadog supports a variety of open standards, including OpenTelemetry and OpenTracing.
According to user reviews, AppDynamics is found easier to use, while Datadog is preferred for ease of setup and administration. Users felt that Datadog meets the needs of their business better than AppDynamics. When comparing the quality of ongoing product support, reviewers felt that Datadog is the preferred option.

New Relic
AppDynamics and New Relic are both leading players in the infrastructure monitoring sector. AppDynamics was founded in 2008 and offers an application performance monitoring platform that’s designed to monitor your application stack and your network infrastructure. It uses intelligent performance engines such as App iQ, Microservices iQ, Baseline iQ, Diagnostic iQ, and Signal iQ. It’s mainly aimed at larger companies with brands such as Cisco, Expedia, Nasdaq, and DirecTV using the product. It supports programming languages like Java, .NET, PHP, Node.js, C++, Python, Go and offers over 130 extensions. It’s compatible with Amazon EC2, AWS EC2, and AWS Elastic Cache.
On the other hand, New Relic was founded in 2006 and offers a SaaS-based solution with a range of infrastructure monitoring capabilities. It can monitor on-premises, cloud-based, and hybrid installations. Its products include New Relic APM, New Relic Infrastructure, New Relic Browser, New Relic Mobile, New Relic Synthetics, and New Relic Insights. It’s used by companies from Zendesk, Hearst, Office Depot, and Trulia. It supports programming languages like Java, .NET, Node.js, PHP, Python, Ruby, Go and offers over 100 plugins. It’s compatible with Amazon EC2, Amazon Elastic Book Store, Amazon RDS, Amazon SQS, Oracle Database, MySQL, Citrix NetScaler, Microsoft Azure SQL, Database, Apache HTTPd, and Red Hat.
In a head-to-head comparison, reviewers found AppDynamics easier to use and do business with overall. However, they preferred the ease of setup with New Relic, along with administration. Reviewers felt that New Relic meets the needs of their business better than AppDynamics. When comparing the quality of ongoing product support, reviewers felt that New Relic is the preferred option. For feature updates and roadmaps, reviewers preferred the direction of AppDynamics over New Relic.
IBM Instana
IBM Instana and AppDynamics are both well-regarded Application Performance Management (APM) tools, each with its own unique strengths. When it comes to user reviews, IBM Instana has a slightly higher rating of 4.4 out of 5 stars based on 333 reviews, while AppDynamics has a rating of 4.3 out of 5 stars from 371 reviews. However, users have found AppDynamics to be easier to use.
In terms of setup and administration, IBM Instana is the preferred choice among users. They also prefer the quality of ongoing product support provided by IBM Instana. However, when it comes to feature updates and roadmaps, AppDynamics is the preferred choice.
Both AppDynamics and IBM Instana offer good integration capabilities with most of the measured tools, making them safe choices if integration is a major concern. As for pricing, the models for both tools vary, so it’s best to contact the vendors for the most accurate and up-to-date information.
AppDynamics is an enterprise-grade tool suitable for complex hybrid environments and stands out with its tight integration of automation (AIOps) features with its APM offering. IBM Instana, on the other hand, is well-suited to small/midsize cloud/SRE teams and offers near-comprehensive metric instrumentation with real-time data intervals.
SignalFx
AppDynamics is a well-known tool for application performance monitoring. It’s particularly appreciated for its deep diagnostics and transaction flow monitoring, which can be very useful for highly distributed applications. It has a larger customer base with 7,381 customers and it’s ranked 3rd in the Application Performance Monitoring category. The employees at AppDynamics seem to enjoy their perks and benefits, rating them 77 out of 100.
On the other hand, SignalFx, which is described as “Monitoring and Operational Intelligence for the Cloud”, has a smaller customer base with 1,128 customers. It’s ranked 10th in the same category. The Perk and Benefits Score at SignalFx is not specified.

Splunk
Splunk and AppDynamics are both powerful tools, but they have different areas of focus. AppDynamics is primarily known for its detailed insights into application performance, including a geographical map of the customer journey. On the other hand, Splunk allows you to monitor connected applications through the use of machine data.
When it comes to ease of use, AppDynamics is generally considered easier to use, while Splunk Enterprise is seen as easier to set up and do business with overall. In terms of support and business partnership, reviewers have felt that Splunk Enterprise offers better ongoing product support and has been a better business partner.
Looking at product direction, reviewers have preferred the direction of AppDynamics over Splunk Enterprise when it comes to feature updates and roadmaps. Both tools offer AI and machine learning capabilities, but the specific features and effectiveness may vary.
Both tools also offer cloud monitoring, server monitoring, and autodiscovery, but again, the specifics and effectiveness can vary. Additionally, both tools offer extensions and add-ons for enhanced functionality.
In summary, AppDynamics focuses on real-time Application Performance Monitoring (APM), while Splunk specializes in log analytics and broader data analysis capabilities. The choice between the two would depend on the specific needs and requirements of your organization.
CA Inc
AppDynamics and CA Inc, specifically CA App Synthetic Monitor, are both recognized in the field of Application Performance Monitoring (APM) and Observability. However, based on user reviews and features, they have different standings.
AppDynamics is ranked 5th in APM and Observability with 26 reviews. Users appreciate its good tracing capabilities and helpful technical support. It’s noted for improving the productivity of Application Engineers and development teams. Features such as Business iQ (based on analytics), visibility of information flows, transition tracing, and the ability to track transactions between different applications are highly valued.
On the other hand, CA App Synthetic Monitor is ranked 46th in APM and Observability with just 1 review. It doesn’t seem to be as popular or highly rated among users compared to AppDynamics.
In conclusion, while both tools have their strengths, AppDynamics appears to be more popular and highly rated among users.

BMC
BMC and AppDynamics are both key players in the IT Operations Management field. They are American companies that specialize in different areas. AppDynamics focuses on managing the performance and availability of applications across cloud computing environments and inside the data center. On the other hand, BMC develops software used for multiple functions, including IT service management, data center automation, performance management, virtualization lifecycle management, and cloud computing management.
When it comes to product quality, both companies have similar ratings with BMC slightly ahead with a rating of 4 out of 5, compared to AppDynamics’ 3.9 out of 5. However, AppDynamics is rated slightly higher in terms of pricing, with a rating of 3.9 out of 5, while BMC has a rating of 3.6 out of 5.
In terms of customer service, both companies have the same rating of 3.7 out of 5. However, when we look at the Net Promoter Score (NPS), which measures customer loyalty, AppDynamics leads with a score of 24, compared to BMC’s score of 7.
The CEO of AppDynamics, David Wadhwani, has a rating of 79 out of 100, while BMC’s CEO, Ayman Sayed, has a slightly higher rating of 82 out of 100. In terms of overall culture, BMC leads with a rating of 79 out of 100, compared to AppDynamics’ rating of 66 out of 100.
ITRS
AppDynamics, with a score of 8.1 out of 10, is a well-regarded application performance management (APM) tool. It’s known for its application mapping and predictive capabilities, which allow for automated remediation and real-time, code-level diagnostics. You can deploy AppDynamics either on-premise or as a SaaS, and it offers a free trial and a freemium version. Users have praised its application monitoring, capacity planning, and drill-down capabilities. However, some users have mentioned a learning curve and limitations in infrastructure monitoring, predictive analysis, visualization options, and integration options.
On the other hand, ITRS Geneos, scoring 4.3 out of 10, is an IT infrastructure, application, and transaction flow monitoring solution. It’s specifically targeted towards the financial industry and its data transaction and performance monitoring needs. Unlike AppDynamics, ITRS Geneos does not offer a free trial or a freemium version. Users have praised its real-time monitoring and hard drive space management. However, it does not have ratings for application monitoring, database monitoring, threshold alerts, predictive capabilities, application performance management console, collaboration tools, server availability and performance monitoring, and server usage monitoring and capacity forecasting.
Acquisition of AppDynamics
Cisco acquired AppDynamics on March 22, 2017, in a deal valued at $3.7 billion. AppDynamics is a leader in application and business monitoring, and the acquisition was aimed at providing comprehensive visibility from code to consumer and everything in between. With AppDynamics, enterprises can watch every line of code and understand its impact on user experience and application performance, while providing real-time insight into the digital business.
David Wadhwani, the then CEO of AppDynamics, stated that the merger would help companies overcome the complexity of modern software so they can deliver exceptional customer experiences and drive better business performance. Rowan Trollope, senior vice president and general manager of Internet of Things (IoT) and Applications at Cisco, mentioned that the acquisition was made because AppDynamics is a market leader in a category that will be a cornerstone for how enterprises drive their business forward.
In its last fiscal period as an independent company, AppDynamics saw year-over-year revenue growth of over 50%, with approximately 75% of last year’s product revenue purely subscription-based. The company has enjoyed significant success and customer traction, including continued growth with customer wins with the European Organization for Nuclear Research (CERN), Vodafone, and Wells Fargo.
